
5 tools, tips and hacks to maximize your SEO output
5 tools, tips and hacks to maximize your SEO output https://csuiteold.c-suitenetwork.com/wp-content/uploads/2017/08/5-tools-tips-and-hacks-to-maximize-your-seo-output.jpg 800 450 C-Suite Network https://csuiteold.c-suitenetwork.com/wp-content/uploads/2017/08/5-tools-tips-and-hacks-to-maximize-your-seo-output.jpg
Part of being an effective SEO is being incredibly efficient with the tasks at hand. You just aren’t going to have the time needed to go deeper and continue to add value if you’re spinning your wheels doing manual, repetitive tasks.
Because of this, we have always valued things that can make you more efficient: tools, scripts, automation, and even interns!
Today, we dig deep into our toolbox to pull out five of our favorite ways to maximize your SEO productivity output.
1. Automate Google Analytics data extracts & reporting
Generating monthly reports is one of those repetitive tasks that can consume a day or more at the beginning of the month (especially in the agency world!).
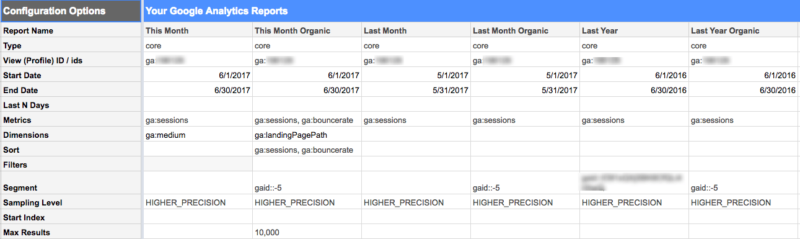
If you’re manually pulling data from Google Analytics, you need to be constantly checking that your date ranges are correct, that you’ve applied the proper segments, that you’re analyzing the right metrics, and that you’ve accessed the primary profile in the first place. Not only would automating this type of reporting save time, but it would also ensure consistency and eliminate mistakes.
And while scheduling reports in Analytics is fine, reporting can really be taken to the next level with the Google Analytics Add-On for Sheets. This add-on is a lifesaver for us during reporting time!

By adding this to Google Sheets, you can pull data directly from the Google Analytics API without ever having to log into the Analytics interface. To start, you’ll need to configure which metrics, date ranges, segments and profile the API should be pulling. Next, you simply run the report; the data is then loaded into your spreadsheet automagically.
The beauty of this whole system is that once you have set up your reporting framework, the amount of time spent gathering Google Analytics data each month should be drastically reduced.
For most of my reports, all I do is adjust the date ranges at the beginning of each month, and I let the API apply all my segments and collect only the metrics I need. I also create charts in the same spreadsheet that reference the cells this data gets pulled into.
With some very minor changes to the spreadsheet each month, I’m able to pull all of the data I need and have it formatted into easy-to-read charts.
This little add-on easily saves me about a day’s worth of work every single month.
2. Find…